Successful completion of the Potato Monitoring Season 2022
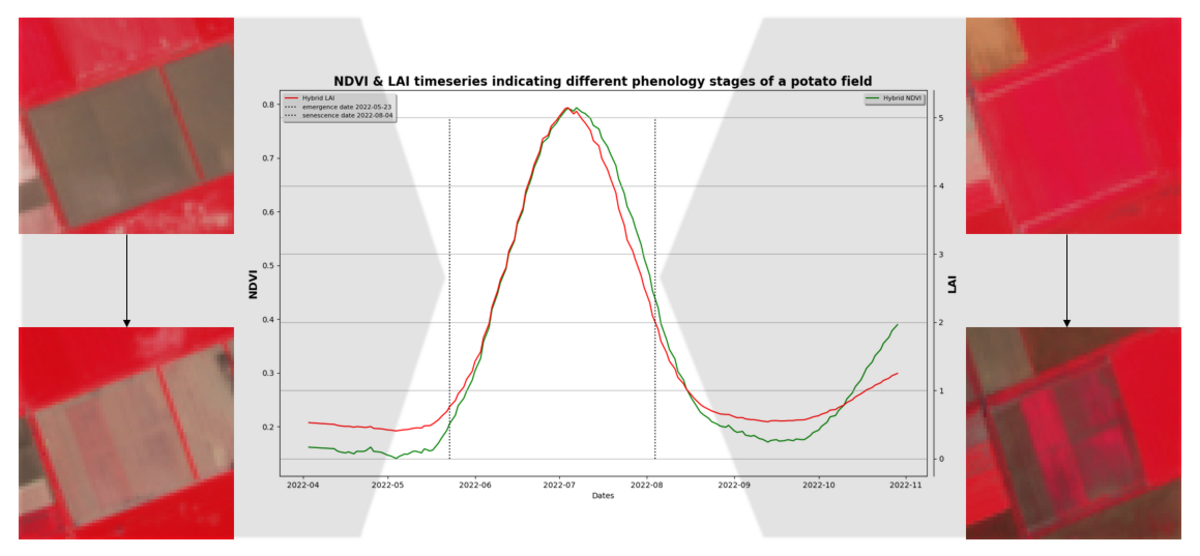
Together with our partner GEO4A in Emmeloord (NL) - the world potato city - we achieved great results in the year 2022. Over the entire potato season, we were able to determine reliable and gap free biophysical indices on potato growth via satellite data in the European Potato Belt covering Netherlands, Belgium and northern parts of France and Germany. In further refinement steps, reliable and timely phenolic stages of the potato plants could be determined - all on a field level.
Within a final step, this EO data was used by GEO4A to support their clients of the potato industry in the full range of business operations, for example by deriving yield quantities and determining meteorological stress factors supplying decision support.
The graph depicts the phenology stages of potato plants on a field level. On the top left of the graph, there is an image of bare soil, indicating the initial state of the field. The bottom left of the graph showcases the date of emergence, signifying the initiation of the growth process. On the top right of the graph, there is a representation of a fully grown potato plant, indicating the peak of the growth cycle. Lastly, on the bottom right of the graph, there is an illustration of senescence, representing the gradual decline of growth and the eventual end of the potato plant's life cycle. The growth curve in the middle of the graph showcases the gradual progression of the plants from emergence to full growth and eventual senescence, rising from the bottom left and gradually declining towards the bottom right.
For the upcoming season, the services will be developed further and who knows, maybe there will be an addition to the portfolio. To be continued…
