New product releases on LandMonitoring.Earth
At the occasion of the ‘European Land Monitoring at its crossroads’ conference held in Innsbruck, Austria, in October, GeoVille has released an update of the LandMonitoring.Earth public portal.
LandMonitoring.Earth is GeoVille’s high resolution global land cover monitoring system to automatically retrieve land cover based on multi-temporal data streams from the Copernicus satellites Sentinel-1 and Sentinel-2 as well as third party missions such as Landsat. The latest release features new products derived with the LandMontoring.Earth processing engine and provides new insights into landscape change in Europe derived from the unprecedented data from the Copernicus Sentinel satellites. The products represent the full information content of each Sentinel-2 image ever recorded, with means that as of November 2018 more than 23.605.726.320.000 pixels were processed.
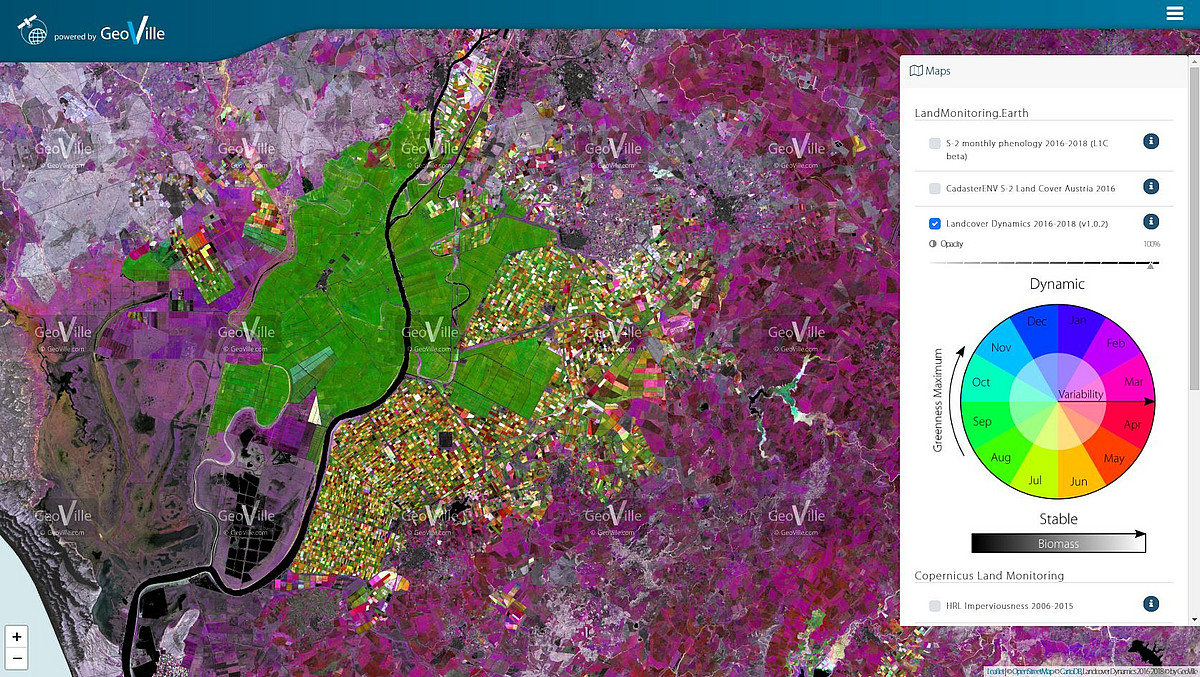
- The land cover dynamics layer is a multi-dimensional layer created for Europe based on time-series metrics extracted from the entire Sentinel-2 image archive. Such a layer is a great support to experts performing land cover classifications, as it gives a complete picture of the dynamic aspect of land cover variations of in a single layer. Dynamics of land cover are shown on multiple dimensions: the biomass is characterised by the brightness of each pixel, the time of the vegetation greenness maximum is reflected in the colour, and the variability across the year is shown in the saturation of a pixel. The land cover dynamics layer will soon be rolled out to the entire landmass of the Earth.
- The phenology layers cover the period from early 2016 to summer 2018 and provide for entire Europe monthly composites of the vegetation greenness. This information can be used to analyse areas with strong vegetation variation and frequent seasonal changes, such as cropland and grassland. This dynamic aspect is inferred from the entire Sentinel-2 image time-series and derived calibrated vegetation index data.
In addition, you can find on the portal the first user-validated Sentinel-2 based land cover map of Austria, developed through the ESA CadasterENV initative. This map is part of the LISA Land Information System Austria and will be updated consecutively. Moreover, data from the Copernicus pan-European Land Monitoring Service such as CORINE Land Cover and the High-Resolution Layers (HRLs) on Imperviousness, Forest, Grassland and Water/Wetness have been added for visualisation purposes.
The LandMontoring.Earth portal also features an ‘Analytics’ section highlighting for all European regions statistics of land cover, phenology and imperviousness. Summary reports for each region can be downloaded under the ‘Reports’ tab.
Stay tuned for future updates!
